Driving Business Success with Data Analytics
Nawazish Ali
August 26, 2024
Unlock the Power of Data: Transforming Businesses with Data Visualization & Analytics
In today’s data-driven world, businesses across industries are relying heavily on data analysis and visualization to make informed decisions. At Intellops, we offer specialized services in data visualization, business intelligence, and analytics to help you turn complex datasets into actionable insights that can drive growth and improve efficiency.
Here’s a look at how we’ve helped businesses using our expertise in data visualization and machine learning
E-commerce Sales Dashboard: Tracking Sales for Better Decision-Making
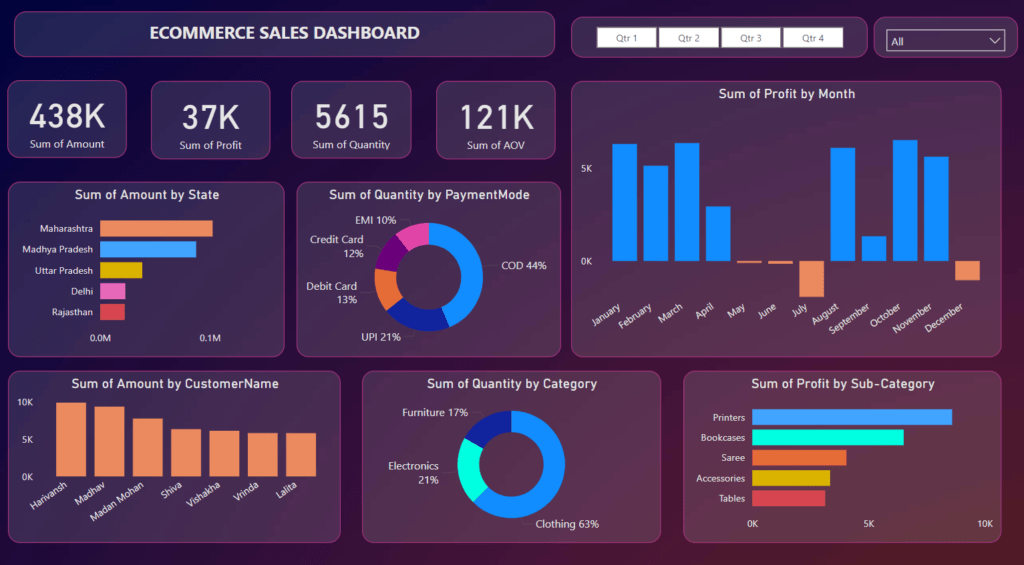
E-commerce companies generate vast amounts of data every day, from customer purchases to website traffic. To help businesses manage and analyze this data, we built an E-commerce Sales Dashboard that offers an in-depth look into online sales performance.
Using complex parameters, filters, and slicers, we created an interactive dashboard where business owners can drill down into their sales data and analyze trends. With customized visualizations, including bar charts, scatter plots, and maps, businesses can now track their sales more efficiently, forecast demand, and adjust their strategies to meet customer needs.
HR Analytics: Improving Employee Experience and Retention
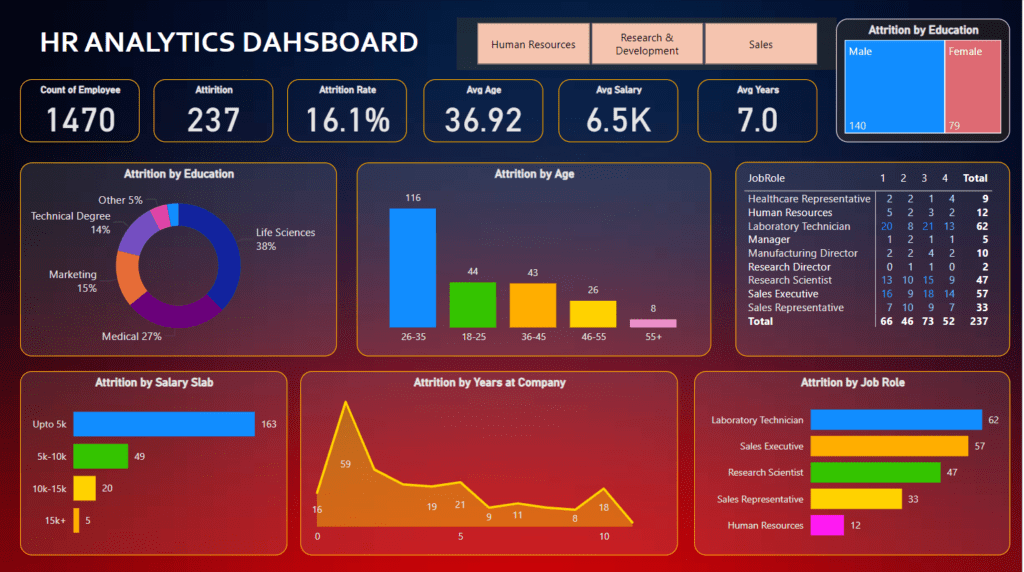
Employee turnover is costly for any business. To help companies reduce attrition and boost employee satisfaction, we designed a comprehensive HR Analytics Dashboard that offers deep insights into workforce trends.
Using data analytics, we identified key factors contributing to employee attrition and provided solutions to improve the hiring process and enhance the overall employee experience. By leveraging the power of HR data, companies are able to create a more productive workforce, reduce turnover, and gain the trust of their employees.
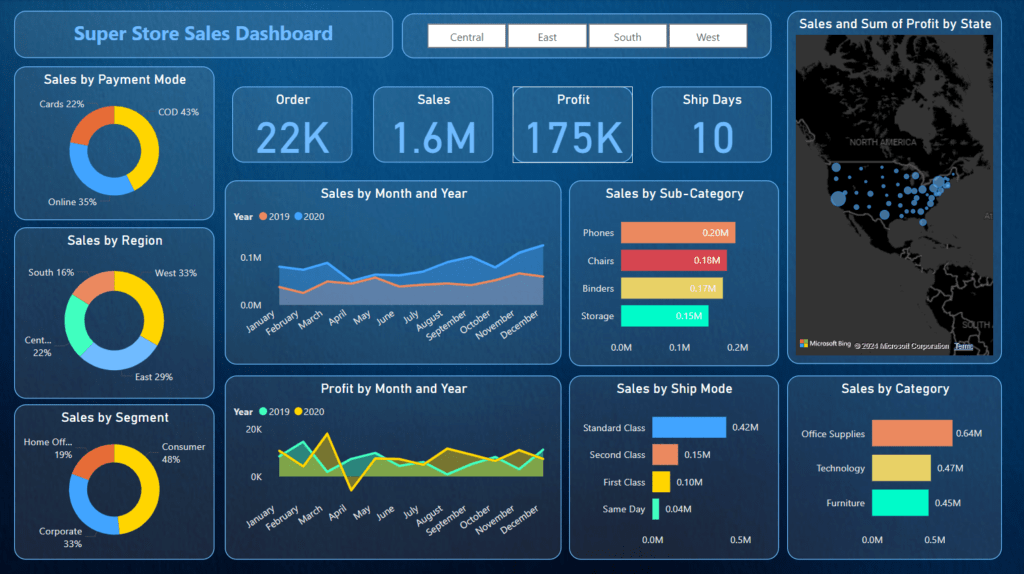
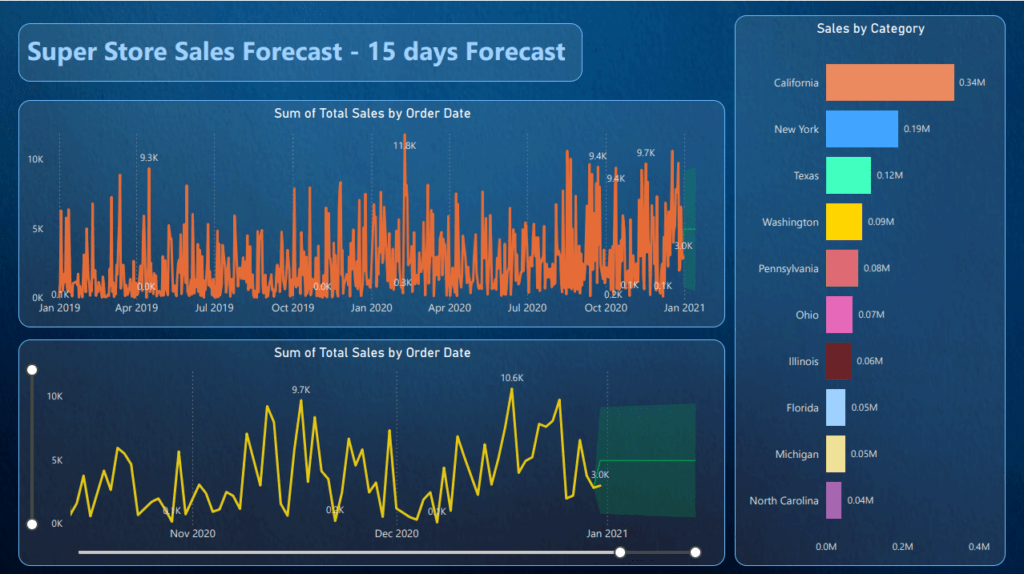
Super Store Sales Dashboard: Accurate Sales Forecasting for Smarter Strategies
Retailers need accurate sales data and forecasting to make smart decisions about inventory, promotions, and customer engagement. Our Super Store Sales Dashboard incorporates advanced data analysis techniques, including time series analysis, to help businesses forecast sales with precision.
The interactive dashboard we developed provides valuable insights into seasonal trends and customer behavior, enabling business owners to make data-driven decisions that boost profitability and streamline operations.
Airbnb Data Visualization: Optimizing Listings for Higher Revenue
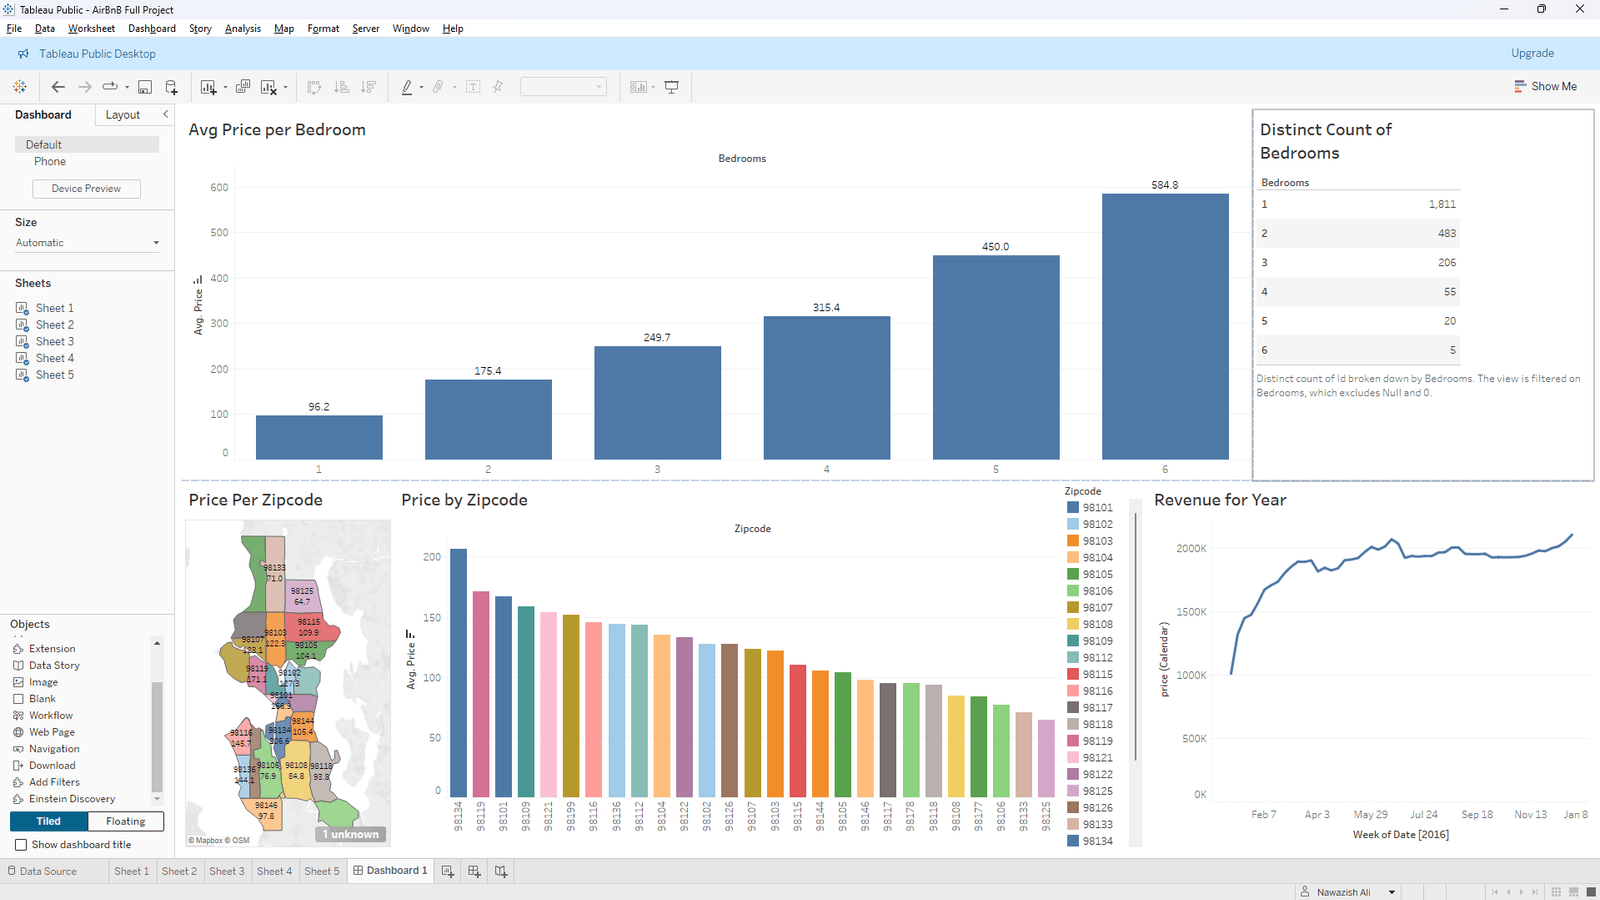
The vacation rental market is highly competitive, and staying ahead requires more than just good property management. Through our Airbnb Data Visualization Project, we created interactive dashboards using Tableau to display key insights like pricing trends, occupancy rates, and property distributions.
Our analysis provided clients with clear, actionable insights to help them optimize their listings, leading to higher revenue and better occupancy. By visualizing large amounts of data, we help property owners make smart decisions that impact their bottom line.
Why Choose Intellops?
At Intellops, we understand that every business is unique, which is why we tailor our data analytics and visualization services to meet your specific needs. Whether you’re looking to optimize your operations, improve customer experience, or forecast future trends, we have the expertise to turn your raw data into clear, actionable insights.
Our technology stack includes tools like Tableau, Power BI, Python, and MySQL, which we use to build customized dashboards, automate processes, and provide cutting-edge solutions that help businesses grow.
Get in Touch
Ready to transform your business with data-driven insights? Contact Intellops today to learn how our data visualization and analytics services can help you make smarter decisions and stay ahead of the competition.